Energy
Middle East 01
Original headline
Choose a region. Follow the tensions. See the financial backdrop.
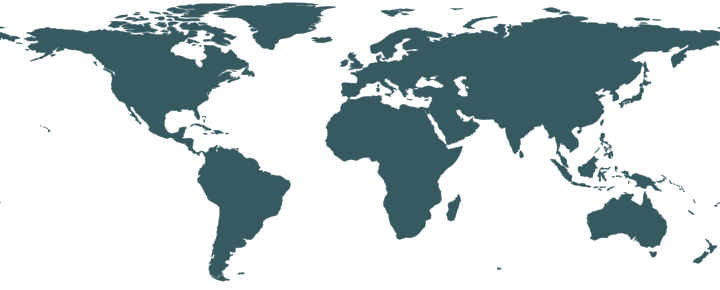
Select a marker or a region below. Colour shows tension-related news coverage, not a forecast. Markers are indicative.
Regional signals use the saved feed dated Oct 16, 11:54 a.m. ET. Refresh to check for newer reporting.
Headlines mentioning conflict, attacks or military escalation.
Why it can matter
Disruption to production, infrastructure and cross-border activity.
This worldwide indicator stays the same when you change region. It measures financial stress; it does not assign a financial risk score to individual regions.
Financial stress is at or below its historical average. Geopolitical tensions can still be significant.
Dashed line: historical average (0)
| Observation date | OFR FSI |
|---|---|
| Oct 14, 2026 | -2.195 |
| Oct 13, 2026 | -2.139 |
| Oct 12, 2026 | -2.154 |
| Oct 9, 2026 | -2.122 |
| Oct 8, 2026 | -1.999 |
| Oct 7, 2026 | -1.929 |
| Oct 6, 2026 | -2.152 |
| Oct 5, 2026 | -2.109 |
| Oct 2, 2026 | -2.088 |
| Oct 1, 2026 | -2.036 |
| Sep 30, 2026 | -2.349 |
| Sep 29, 2026 | -2.244 |
| Sep 28, 2026 | -2.222 |
| Sep 25, 2026 | -2.630 |
| Sep 24, 2026 | -2.398 |
| Sep 23, 2026 | -2.663 |
| Sep 22, 2026 | -2.773 |
| Sep 21, 2026 | -2.727 |
| Sep 18, 2026 | -2.734 |
| Sep 17, 2026 | -2.593 |
| Sep 16, 2026 | -2.411 |
| Sep 15, 2026 | -2.244 |
| Sep 14, 2026 | -2.226 |
| Sep 11, 2026 | -2.458 |
| Sep 10, 2026 | -2.289 |
| Sep 9, 2026 | -2.411 |
| Sep 8, 2026 | -2.537 |
| Sep 7, 2026 | -2.874 |
| Sep 4, 2026 | -2.791 |
| Sep 3, 2026 | -2.725 |
The contribution from corporate borrowing spreads. Higher readings can reflect greater concern about borrowers.
Positive values add above-average stress; negative values offset it. Components are contributions, not separate probability scores.
The contribution from stock-market valuations, capturing changes in investors’ appetite for risk.
Positive values add above-average stress; negative values offset it. Components are contributions, not separate probability scores.
The contribution from financing conditions. Stress can make it harder for financial institutions to obtain funds.
Positive values add above-average stress; negative values offset it. Components are contributions, not separate probability scores.
The contribution from assets investors use as a refuge when uncertainty increases.
Positive values add above-average stress; negative values offset it. Components are contributions, not separate probability scores.
The contribution from price uncertainty across several financial markets.
Positive values add above-average stress; negative values offset it. Components are contributions, not separate probability scores.
Source: Office of Financial Research, “OFR Financial Stress Index.” Values may be revised. Independent presentation; no affiliation or endorsement.
The percentage of unique, dated stories in the 72 hours ending at the feed’s displayed fetch time whose headline or short excerpt matches a tension keyword. Categories cover conflict, trade restrictions, energy or shipping disruption, and cyber or infrastructure threats. A story can match several categories; it counts once in the overall percentage.
A reading requires at least 8 stories from 3 publishers. Below that threshold, the map shows limited coverage. Colour bands are 0–24% lower pressure, 25–49% watch, 50–74% elevated and 75–100% intense. These are descriptive coverage bands, not statistically calibrated risk levels. Undated and older reporting is excluded. Publisher selection, duplicated reporting across outlets, tagging errors and incomplete coverage can influence the result.
The official OFR index combines 33 financial-market variables into a global measure. Zero corresponds to the historical average; positive readings indicate above-average stress, and negative readings below-average stress. The five component values contribute to the total; rounding can create small differences. The figures are published daily with a two-business-day lag and may be revised.
Financial readings older than 7 calendar days are marked out of date. A failed refresh preserves the dated saved release. Neither indicator estimates the probability of conflict, predicts investment returns, or tells you whether an investment is safe. This dashboard is for learning and monitoring, not investment advice.